Auto Charting Tools
Trendmaster Auto Charting combines many charting functions into one tool that automatically plots all of the important data that any trader would want directly onto their chart. This is not only a time-saving tool in general but effectively removes any guesswork regarding finding and plotting important levels. This tool is also a great “Confluence” tool with other Trendmaster Indicators as multiple information points converge to show key levels for price reversal.
This Tool is designed to work on EVERY trading pair listed on Tradingview to effectively show key levels automatically.
Indiactor Tools
Some of the Tools in this Indicator are:
-
Auto Charting, S/R Levels & Volume Blocks -
Swing Points -
Candle Identifier -
High Timeframe Opens -
Auto Fibonacci Retracements -
Auto Trendlines -
Price Projection - “Experimental” -
Daily, Weekly, Monthly Ranges -
Global Market Sessions - New York, London, Asia
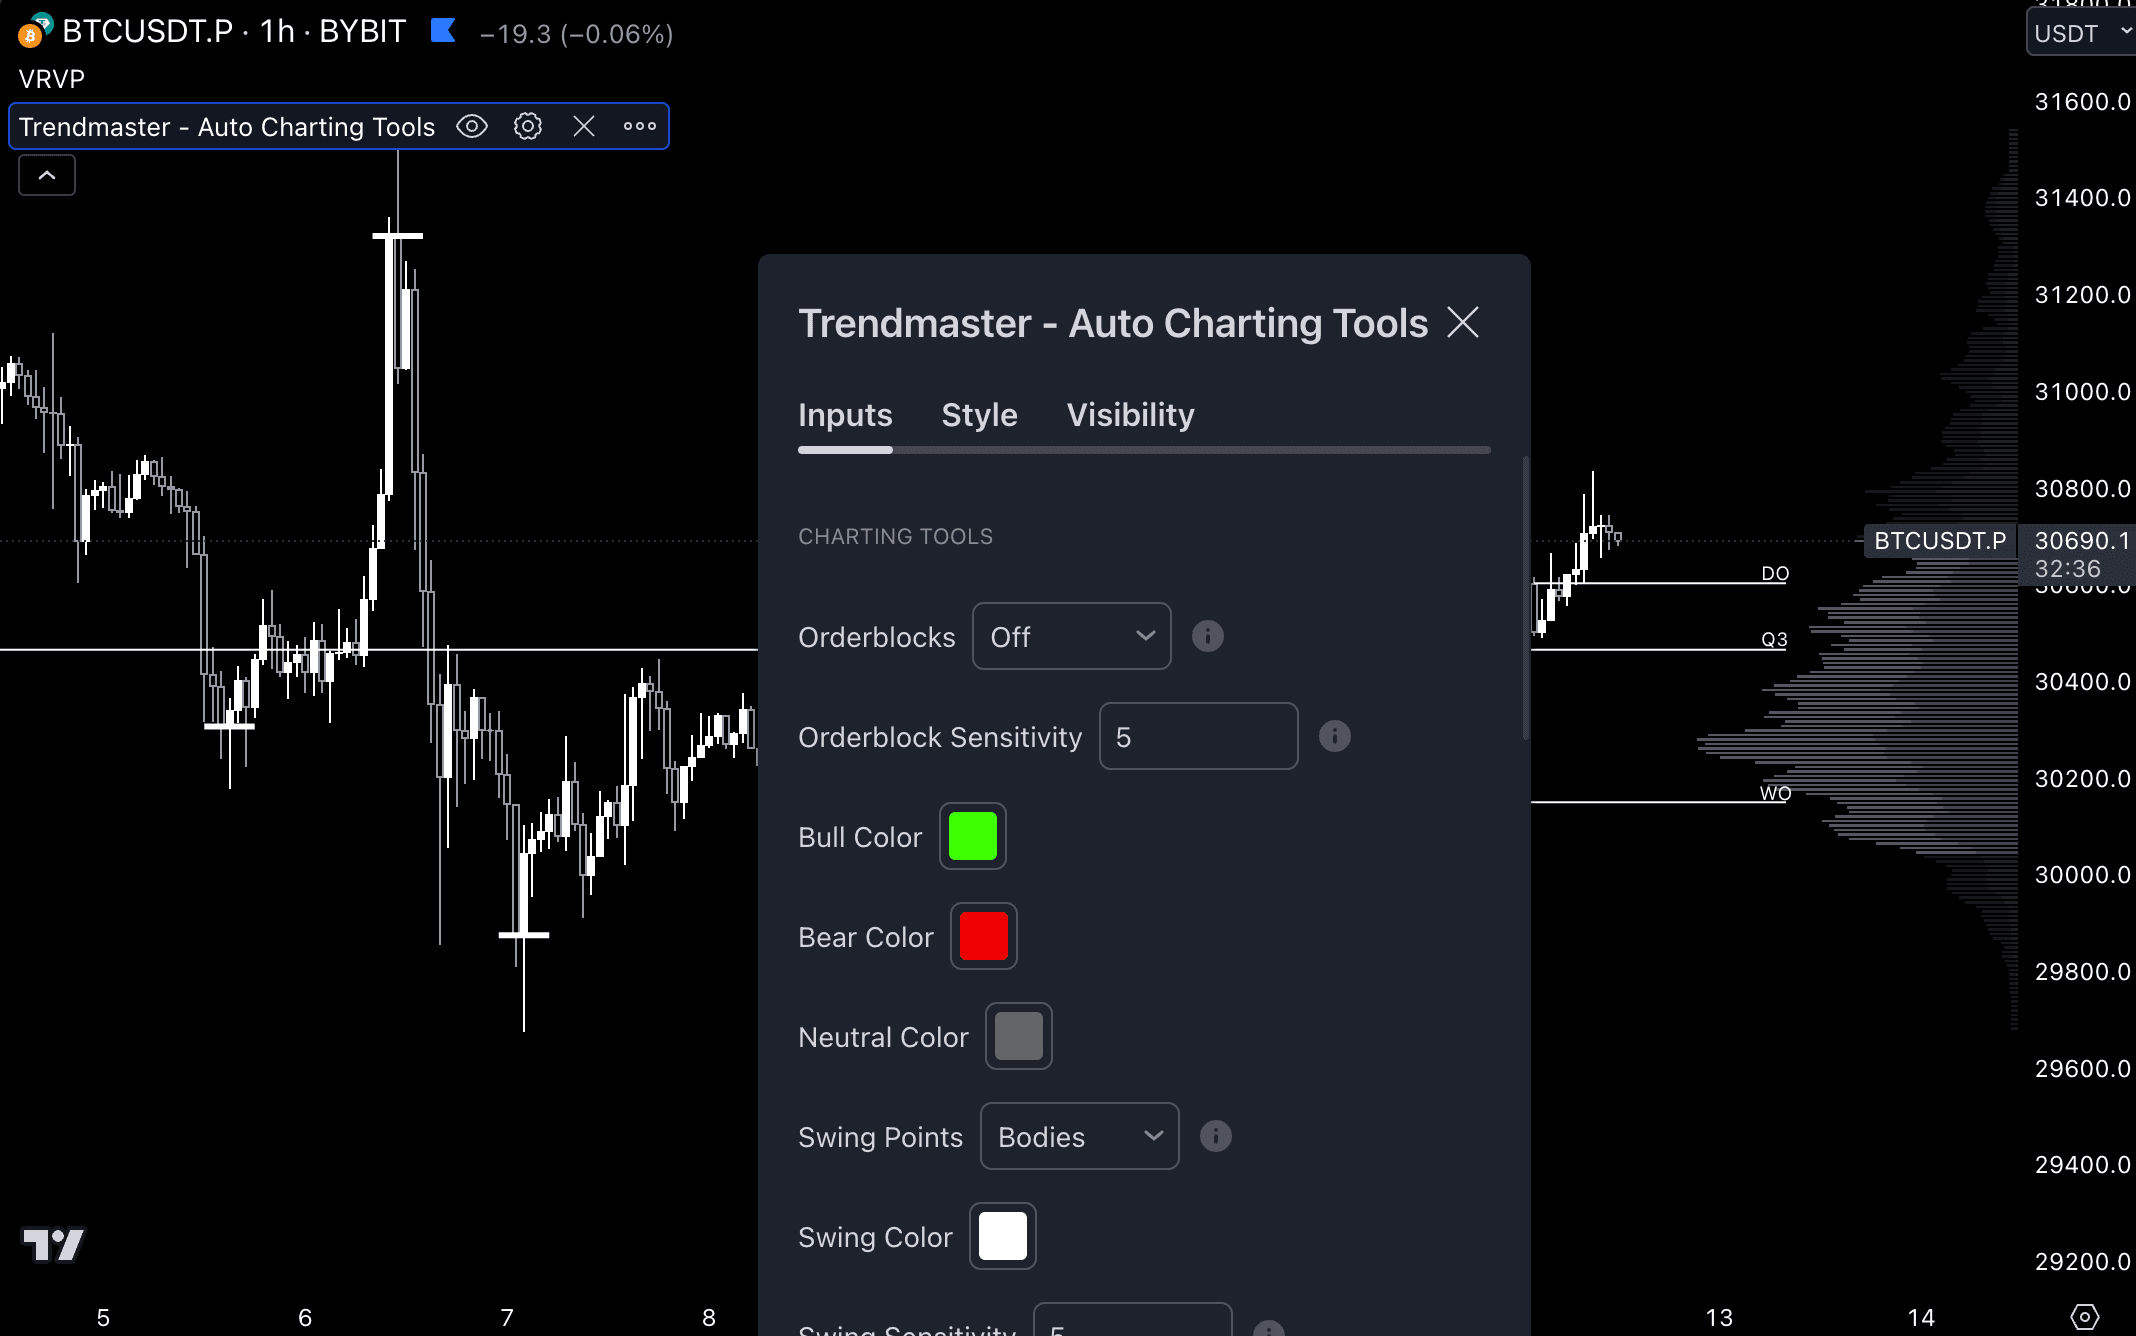
Auto Charting Tools
The Auto Plotting effectively show significant levels of Price Action in a specific area on the chart. It can show S & R (Support and Resistance) Levels, Volume blocks, or Both at the same time.
Orderblocks are highly effective at showing reaction points for Price Action. S & R levels are highly confluent points where price reacts with probability at those levels by a bounce off the levels or “Failing” and “Gaining” which means it passes the level and backtests it before continuing. The Volume Blocks are also useful for entry points as the price comes back into these “Demand Zones” and are effective points for entering as long as the levels are not broken.
Orderblock Modes
- Name
Off- Type
- mode
- Description
Default Position turns off Orderblocks
- Name
S/R- Type
- mode
- Description

This shows the relevant higher timeframe Support and Resistance Levels on the chart from Daily, 3 Day, Weekly, 2 Week, Monthly, Quarterly, and Yearly Levels. This is something that we highly recommend as it shows key High timeframe Support and Resistance Levels. Each level is labeled by timeframe and colored Red if currently a Resistance Level and colored Green if currently a Support Level.
- Name
Blocks- Type
- mode
- Description

The Volume Blocks show areas of high volume engulfing candles that show significant levels of dominance by either Bulls or Bears. The Green colored zones or “Demand Zones” indicate levels where there is a higher probability that price will retrace back to that zone and then continue in an upward direction. The Red colored zones or “Supply Zones” levels where is a higher probability that price will retrace back to that zone and then continue in a downward direction.
- Name
Both- Type
- mode
- Description

Turns on both the S & R Levels at the same time.
Settings
- Name
Sensitivity- Type
- mode
- Description
Orderblocks Sensitivity changes how often the Volume Blocks and S & R levels are plotted onto the chart. The Orderblock Sensitivity can be adjusted from 1 to 10 at .5 increments. The higher the Sensitivity, the more often these levels are plotted. The lower the Sensitivity, the less often these levels are plotted. This is most effective on the Volume Blocks. On higher timeframes increasing the sensitivity will show more relevant Volume Blocks, while on lower timeframes decreasing the sensitivity will reduce the amount of less relevant Volume Blocks.
- Name
Bull Color- Type
- mode
- Description
Changes The Green or “Bullish” Color on the Auto Charting Tools and specifically the Orderblocks.
- Name
Bear Color- Type
- mode
- Description
Changes the Red or “Bearish” Color on the Auto Charting Tools and specifically the Orderblocks
- Name
Neutral Color- Type
- mode
- Description
Changes the Grey or “Neutral” Color on the Auto Charting Tools and specifically the Orderblocks
Swing Points
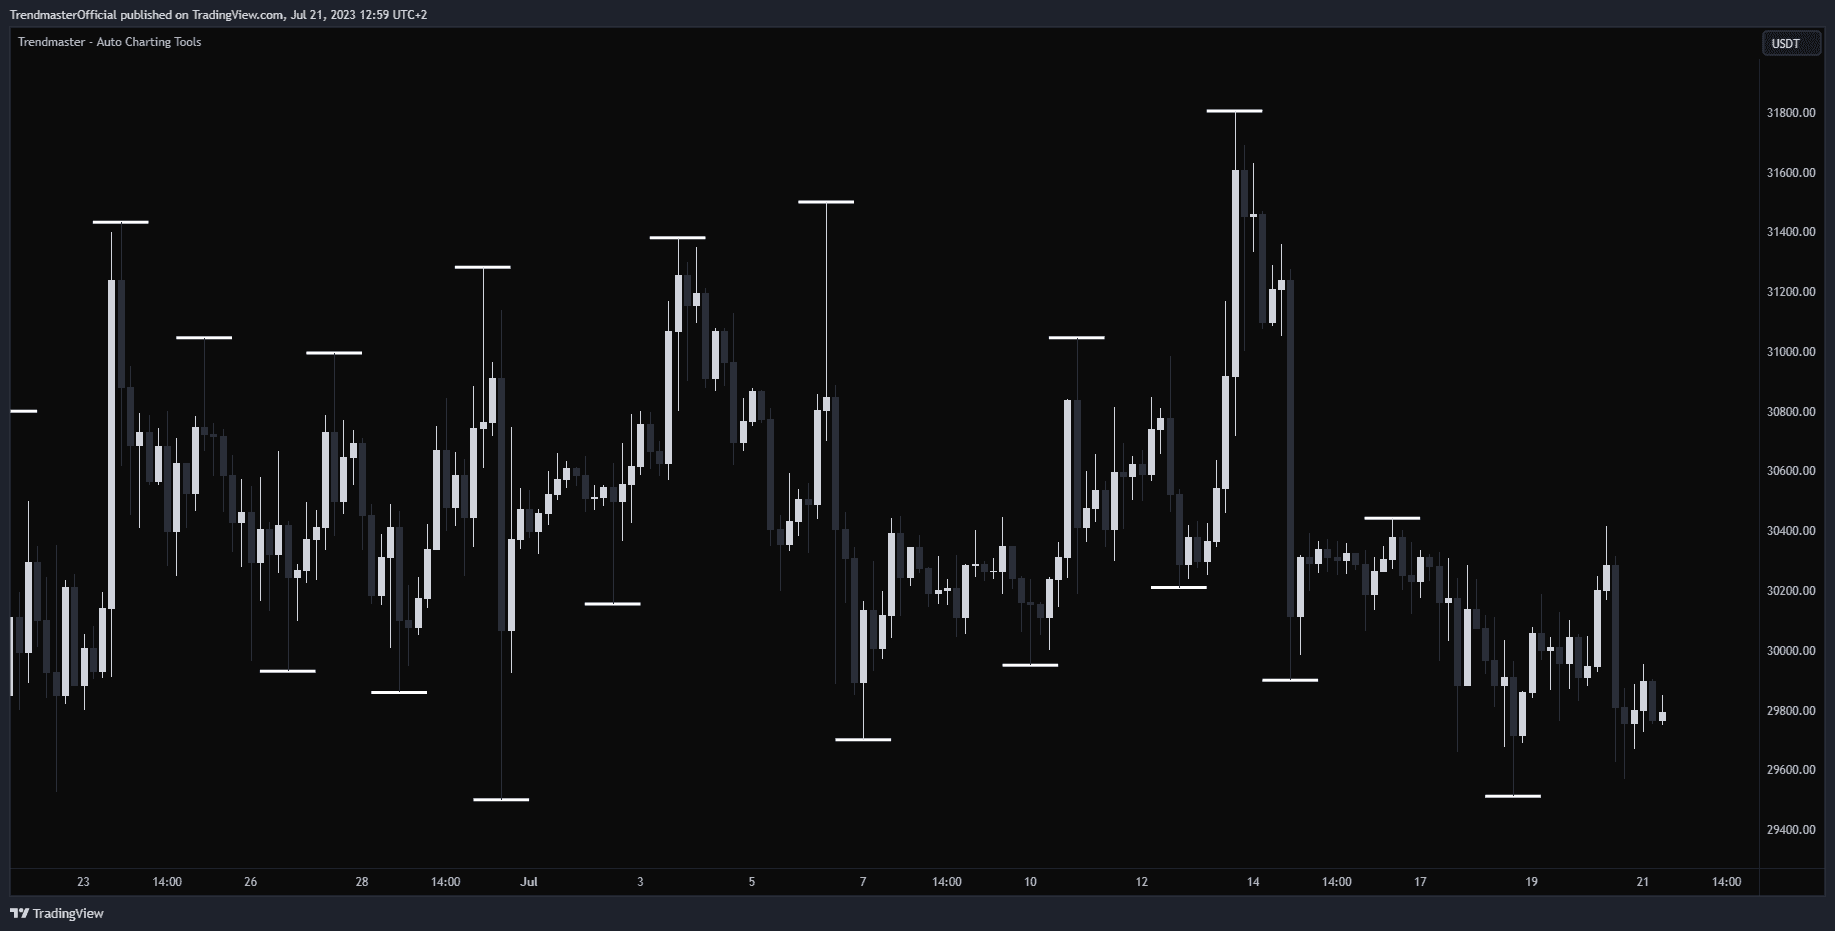
Swing Points are specifically marked as important tops and bottoms in Price Action. Swing Points are significant reversals in the Price Action however it is a lagging indicator. Swing Points are important relevant levels as price often returns to these levels to test, gain, or fail them respectively.
- Swing Points are generally very important in Price Action. One of the most common things we look for is the “Swing Failure Pattern”. The Swing Failure Pattern is when Price creates a new high Swing Point or a new low Swing point and the subsequent swing “Fails” to make a new high higher than the previous Swing Point or “Fails to make a new low lower than the previous Swing Point.
- Swing Points are also relevant as when price continues above or below the previous Swing Point it often retraces to these Swing Points to “Test” them.
- Name
Off- Type
- mode
- Description
Turns the Swing Points off
- Name
Wicks- Type
- mode
- Description
This is Default on and plots Swing Points at the end of the wicks on individual swing points
- Name
Both- Type
- mode
- Description
This plots Swing Points at the end of body candles
- Name
Swing Color- Type
- mode
- Description
Swing Color allows the user to change the color of the Swing Points as they are plotted on the chart
- Name
Swing Sensitivity- Type
- mode
- Description
- Swing Sensitivity changes how often the Swing Points are plotted onto the chart. Swing Sensitivity can be adjusted from 1 to 10 at .5 increments. The higher the Sensitivity, the more often these levels are plotted. The lower the Sensitivity, the less often these levels are plotted. - On higher timeframes increasing the sensitivity will show more relevant Swing Points, while on lower timeframes decreasing the sensitivity will reduce the amount of less relevant Swing Points.
Candle Identifier
The candle identifier is an indicator that specifically scans, identifies, and indicates 14 different candle types and shows them on the chart. This tool is very effective for candle pattern trading strategies that target specific types of candle patterns to enter trades. A user can select which specific candle pattern type they wish to find on any Tradingview Chart.
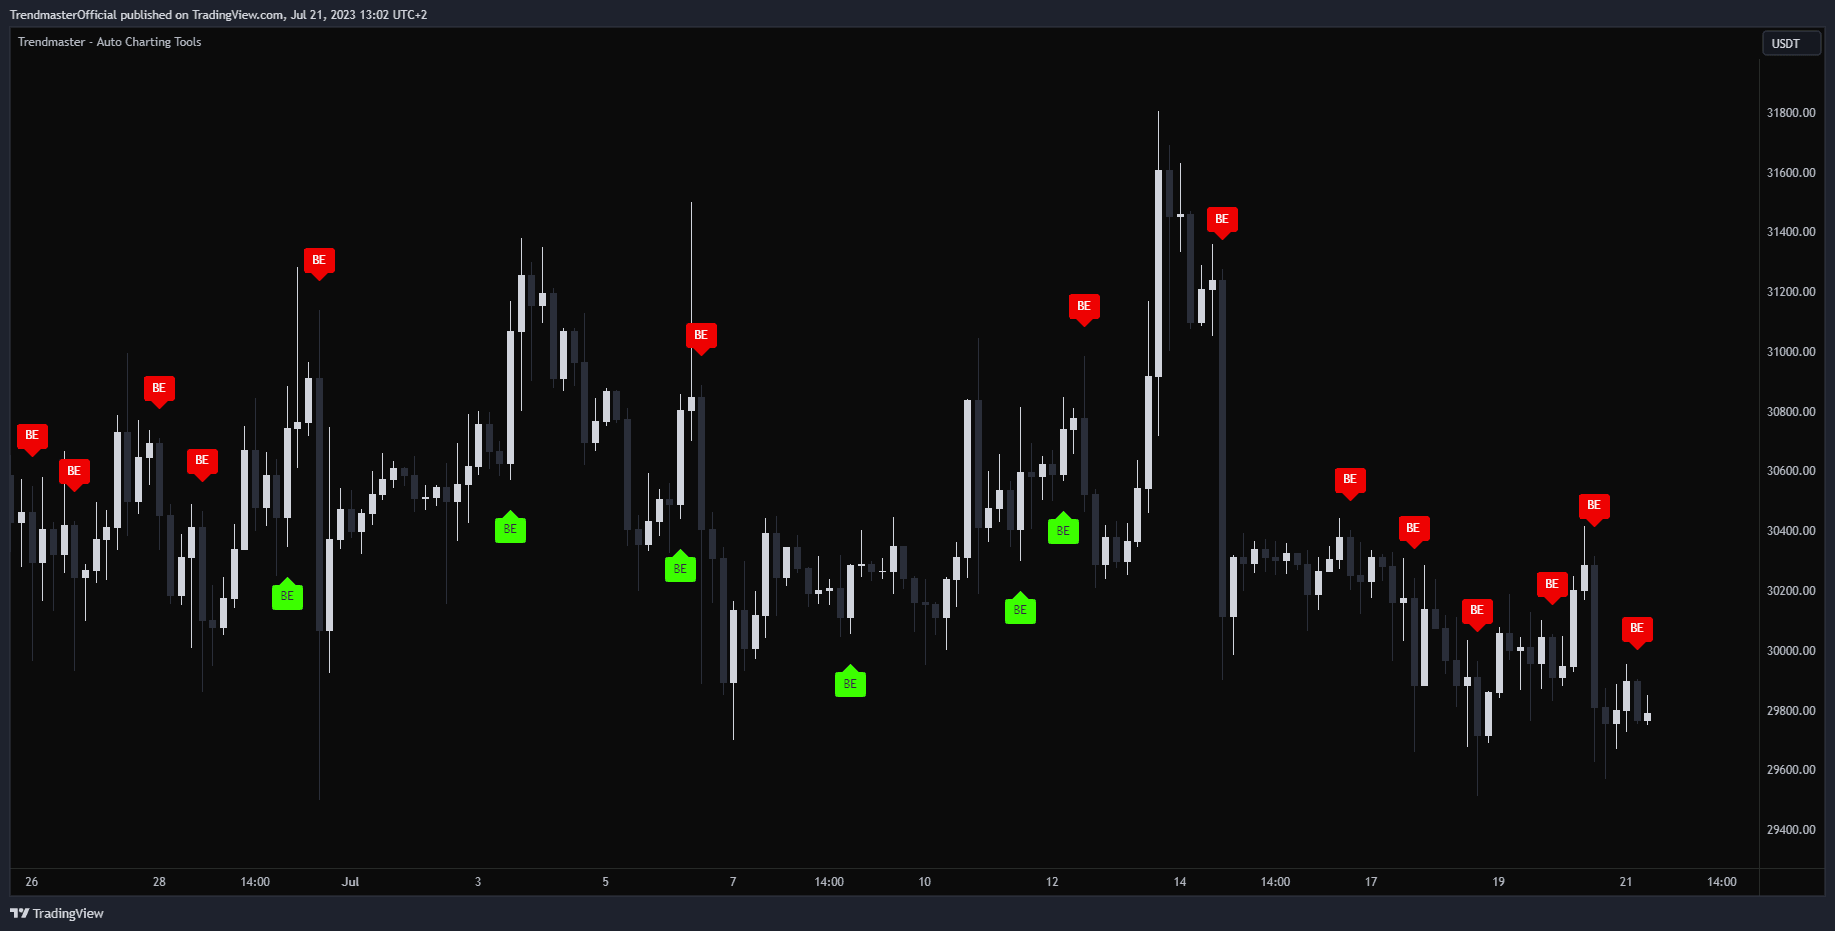
Candle Identifier Types:
- None - Default is off and shows no Candle Patterns
- Abandoned Baby
- Doji
- Engulfing
- Evening Start
- Hammer
- Hanging Man
- Harami
- Kicking
- Long Shadow
- Marubozu
- Star
- Spinning Top
- Three
- Tri-Star
The Candle Identifier will always be the most effective on higher timeframes. This is because the larger general candle pattern moves have a much higher rate of precision than low timeframes. This tool is also most effective in high liquidity markets such as stocks, forex, commodities, and high cap cryptocurrencies such as BTC and ETH. This is because low liquidity can disrupt normal Price Action where Market Makers can more heavily influence that specific trading pair.
Timeframe Opens
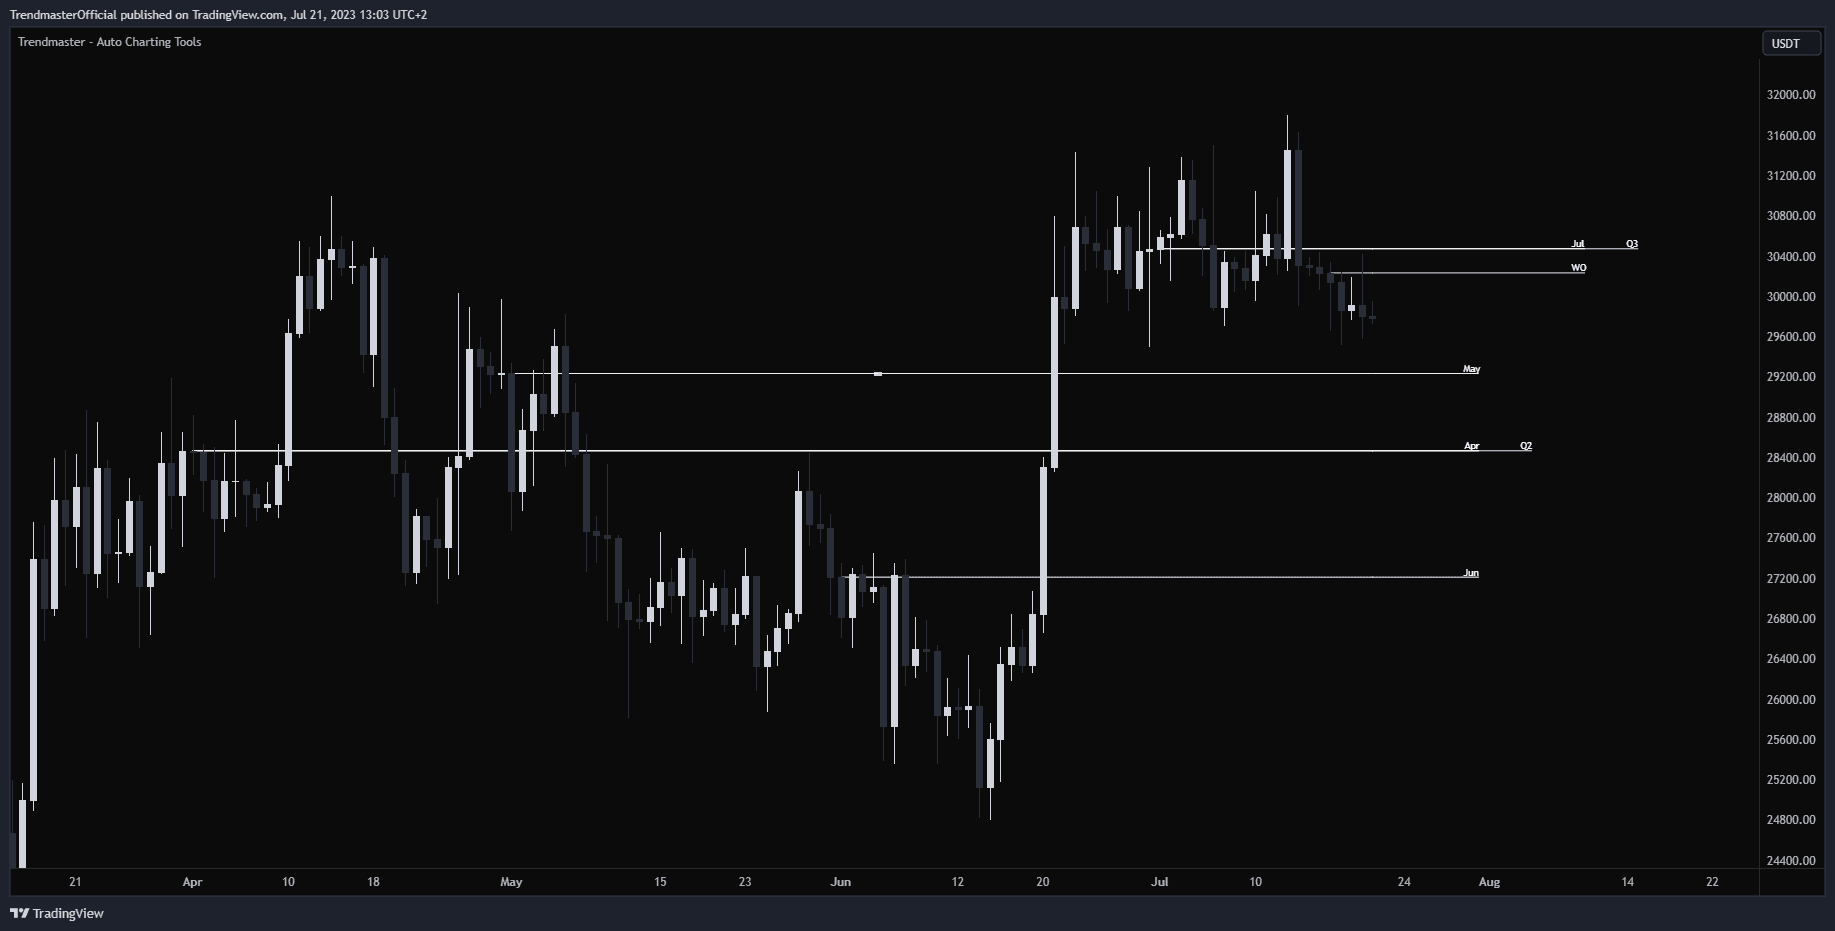
Timeframe Opens is a tool that plots high timeframe open levels, including Daily, Weekly, Monthly, Quarterly, and Yearly Opens, on the chart. Higher timeframe open levels are often retested as they indicate previously relevant levels to the market Price Action. The relevance of these opens varies depending on the trading period's length.
- Name
Daily Opens- Type
- mode
- Description
Displays the current Daily Open for the specific trading pair. Daily opens are often retested intraday. Relevant timeframes: 15min to 4hr.
- Name
Weekly Opens- Type
- mode
- Description
Displays the current Weekly Open for the specific trading pair. Weekly opens are often retested intraday. Relevant timeframes: 4hr to Daily.
- Name
Monthly Opens- Type
- mode
- Description
Displays the current and past 12 Monthly Opens for the specific trading pair. Monthly opens are often retested in the same quarter. Relevant timeframes: Daily, 3 Day, Weekly.
- Name
Quarterly Opens- Type
- mode
- Description
Displays the current and past 4 Quarterly Opens for the specific trading pair. Quarterly Opens are often retested in the same quarter.
- Name
Yearly Opens- Type
- mode
- Description
Displays the current Yearly Open for the specific trading pair. Yearly Opens are relevant at extremely high timeframes. Relevant timeframes: Monthly and Quarterly.
- Name
Opens Color- Type
- color
- Description
The default color for the Timeframe Opens is “Aqua” but can be changed to any color.
Fibonacci Retracements
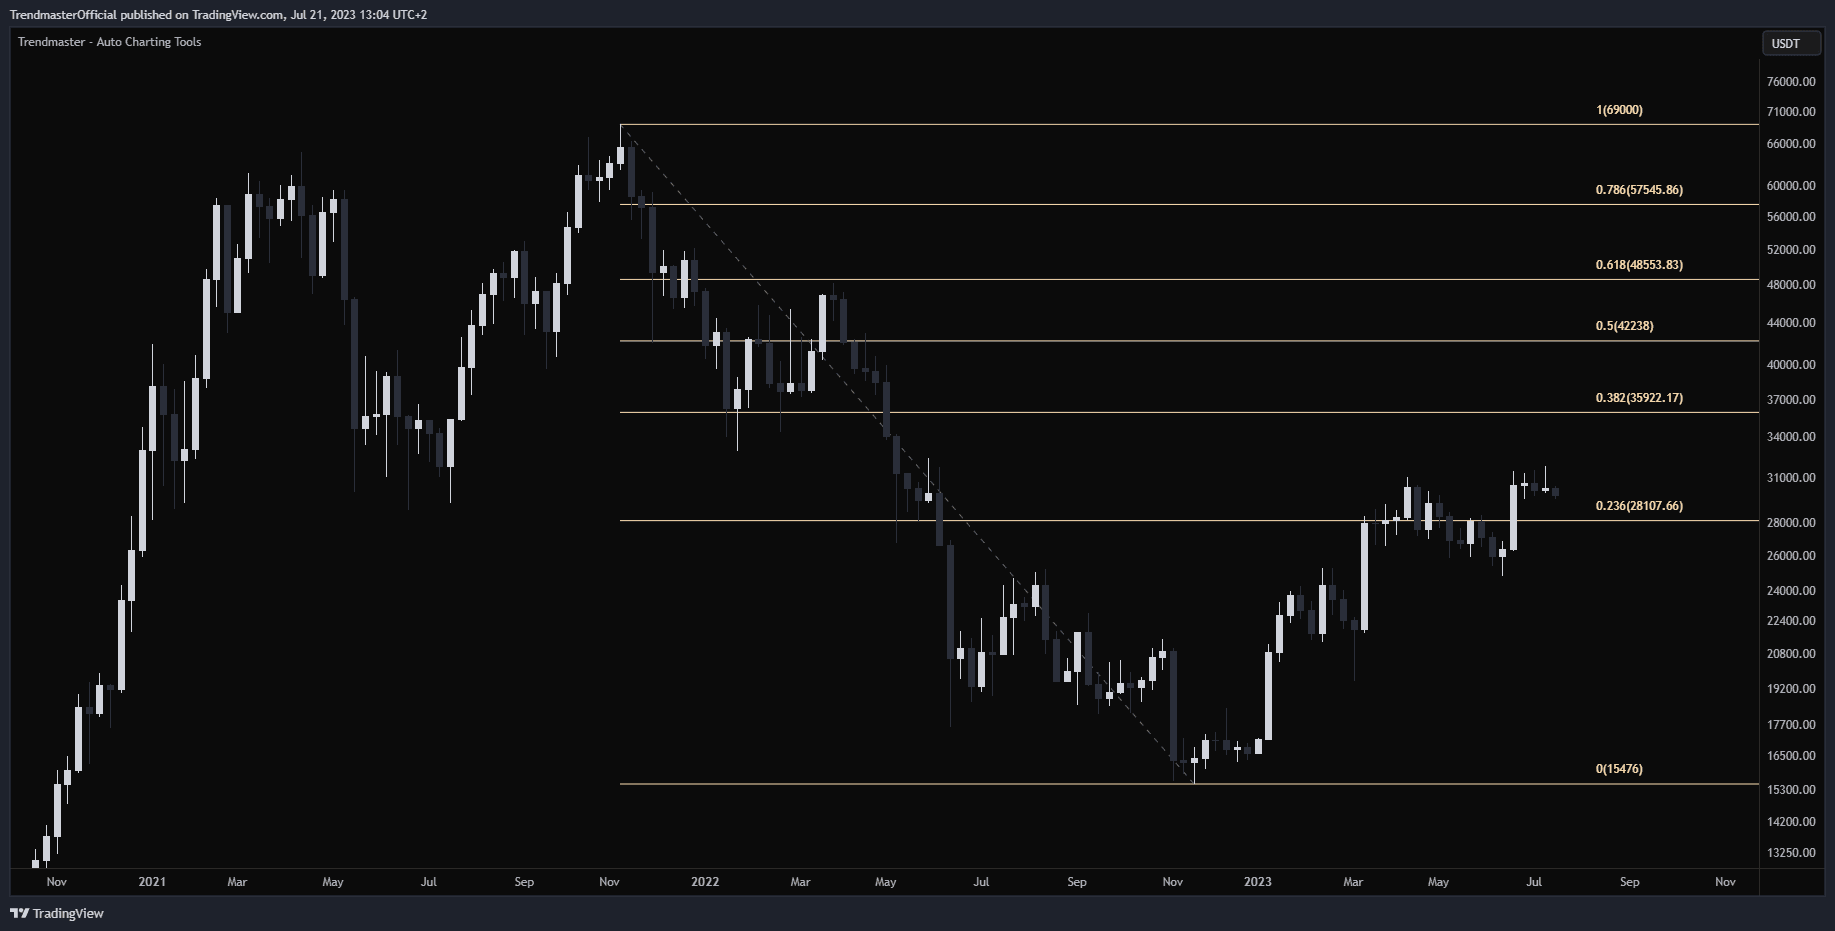
Fibonacci Retracements use levels of 0, .236, .382, .5, .618, .786, and 1. The indicator automatically generates a Fibonacci Retracement from a previous low to high swing or vice versa based on the Price direction. The percentage levels are where the price could stall or reverse with .5 or 50% and .618 or 61.8% being the most crucial levels. The tool should be used as points of confluence with other key levels.
- Name
Fibonacci Retracement Modes- Type
- mode
- Description
- Off: The default position, which turns this tool off.
- Regular: The tool will plot a normal Fibonacci Retracement.
- Reverse: If the indicator plots a Fibonacci Retracement in the wrong direction, then plotting it in the Reverse will flip the Retracement into the correct direction.
- Name
Sensitivity- Type
- mode
- Description
This is related to the sensitivity of the Fibonacci Retracements, which changes the lookback length and deviation of the indicator. The default setting is 5, with a sensitivity range of 1 to 10 at .5 increments. Increasing the sensitivity will plot the Fibonacci Retracements closer to the current Price Action, while decreasing the sensitivity will plot the Fibonacci Retracements further away.
- Name
Style- Type
- style
- Description
Adjusts the type of lines used by the Fibonacci Retracement. The default line is solid but can be changed to dotted or dashed.
- Name
Fibonacci Color- Type
- color
- Description
The default color is orange but can be changed to any color.
Trendlines
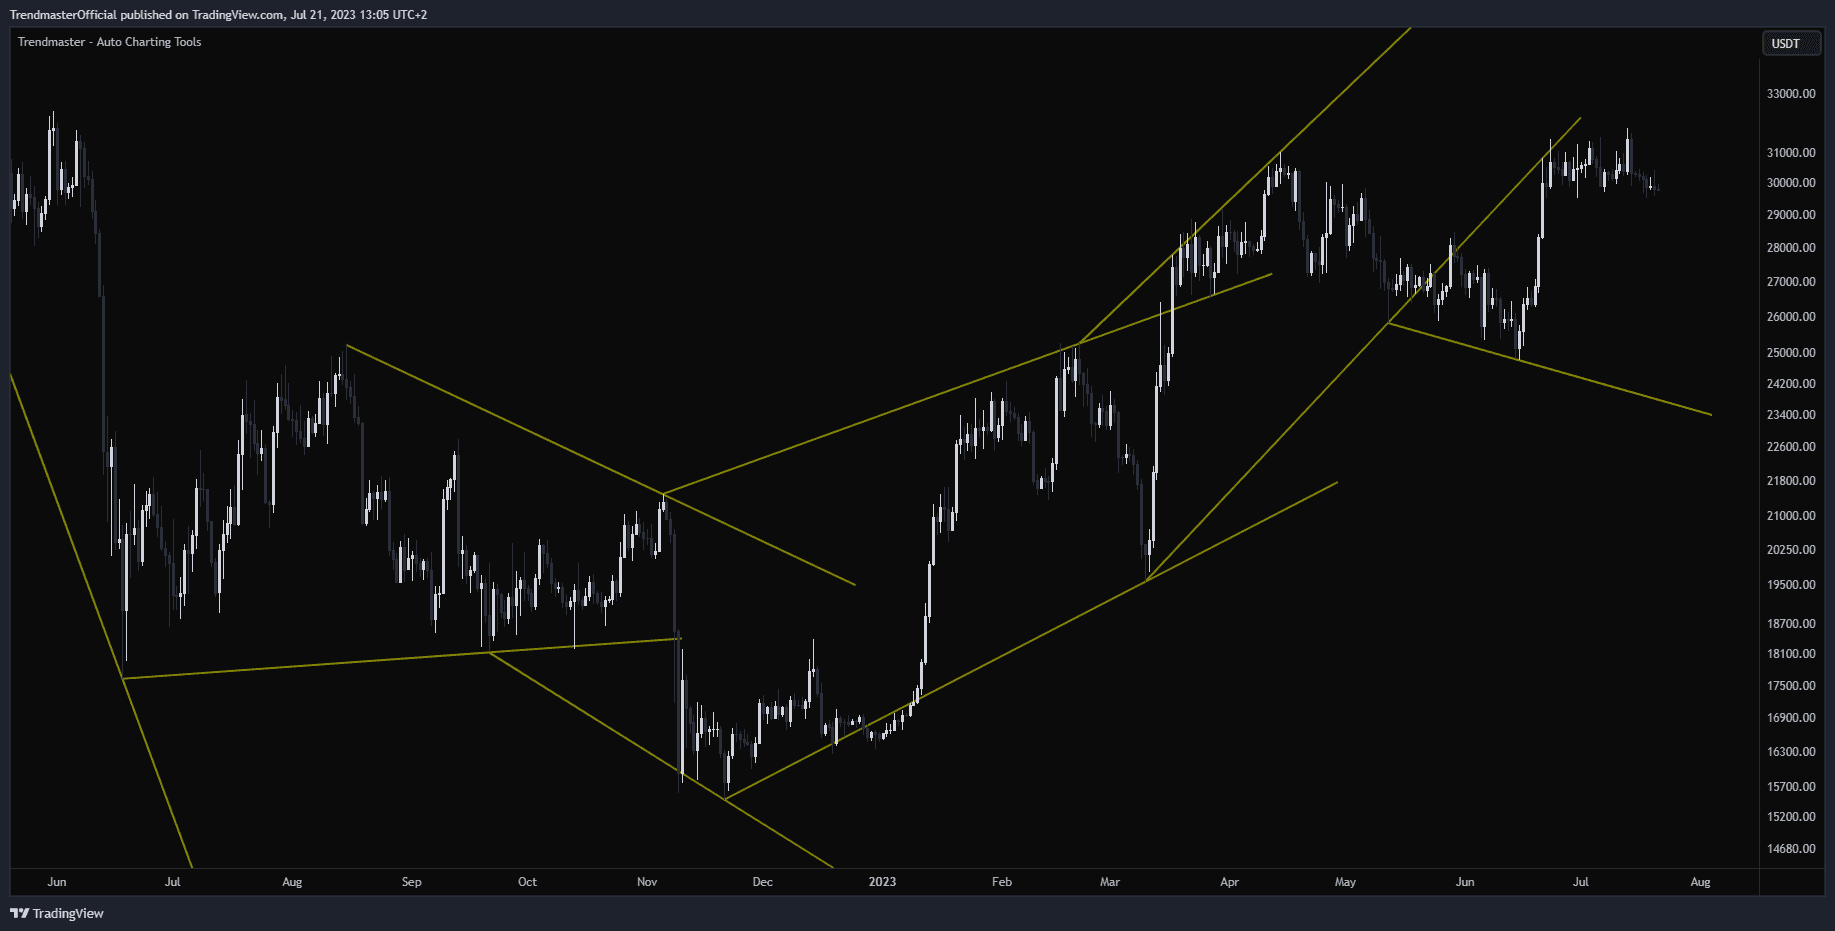
Trendlines is a tool that automatically plots trendlines based on the current Price Action, often used as moving levels of Support and Resistance. It can be especially effective when used in conjunction with other Key Levels to identify potential reversal points.
- Name
Trendlines Modes- Type
- mode
- Description
- Off: Default position, turns the Tool off.
- Wicks: Plots Trendlines automatically using the Wick highs and lows from the relevant Candles(Bars).
- Bodies: Plots Trendlines automatically using the Body highs and lows from the relevant Candles(Bars).
- Name
Sensitivity- Type
- mode
- Description
This relates to the Sensitivity of the Trendlines and changes the lookback length and deviation of the indicator. The default setting is 5 and has a sensitivity range of 1 to 10 at .5 increments. Higher sensitivity plots the Trendlines closer to the current Price Action and more frequently. Lower sensitivity plots the Trendlines further away and less frequently.
- Name
Style- Type
- style
- Description
Adjusts the type of lines used by the Trendlines Tool. The default line is solid but can be changed to dotted or dashed.
- Name
Trendline Color- Type
- color
- Description
The default color is yellow but can be changed to any color.
Price Projection
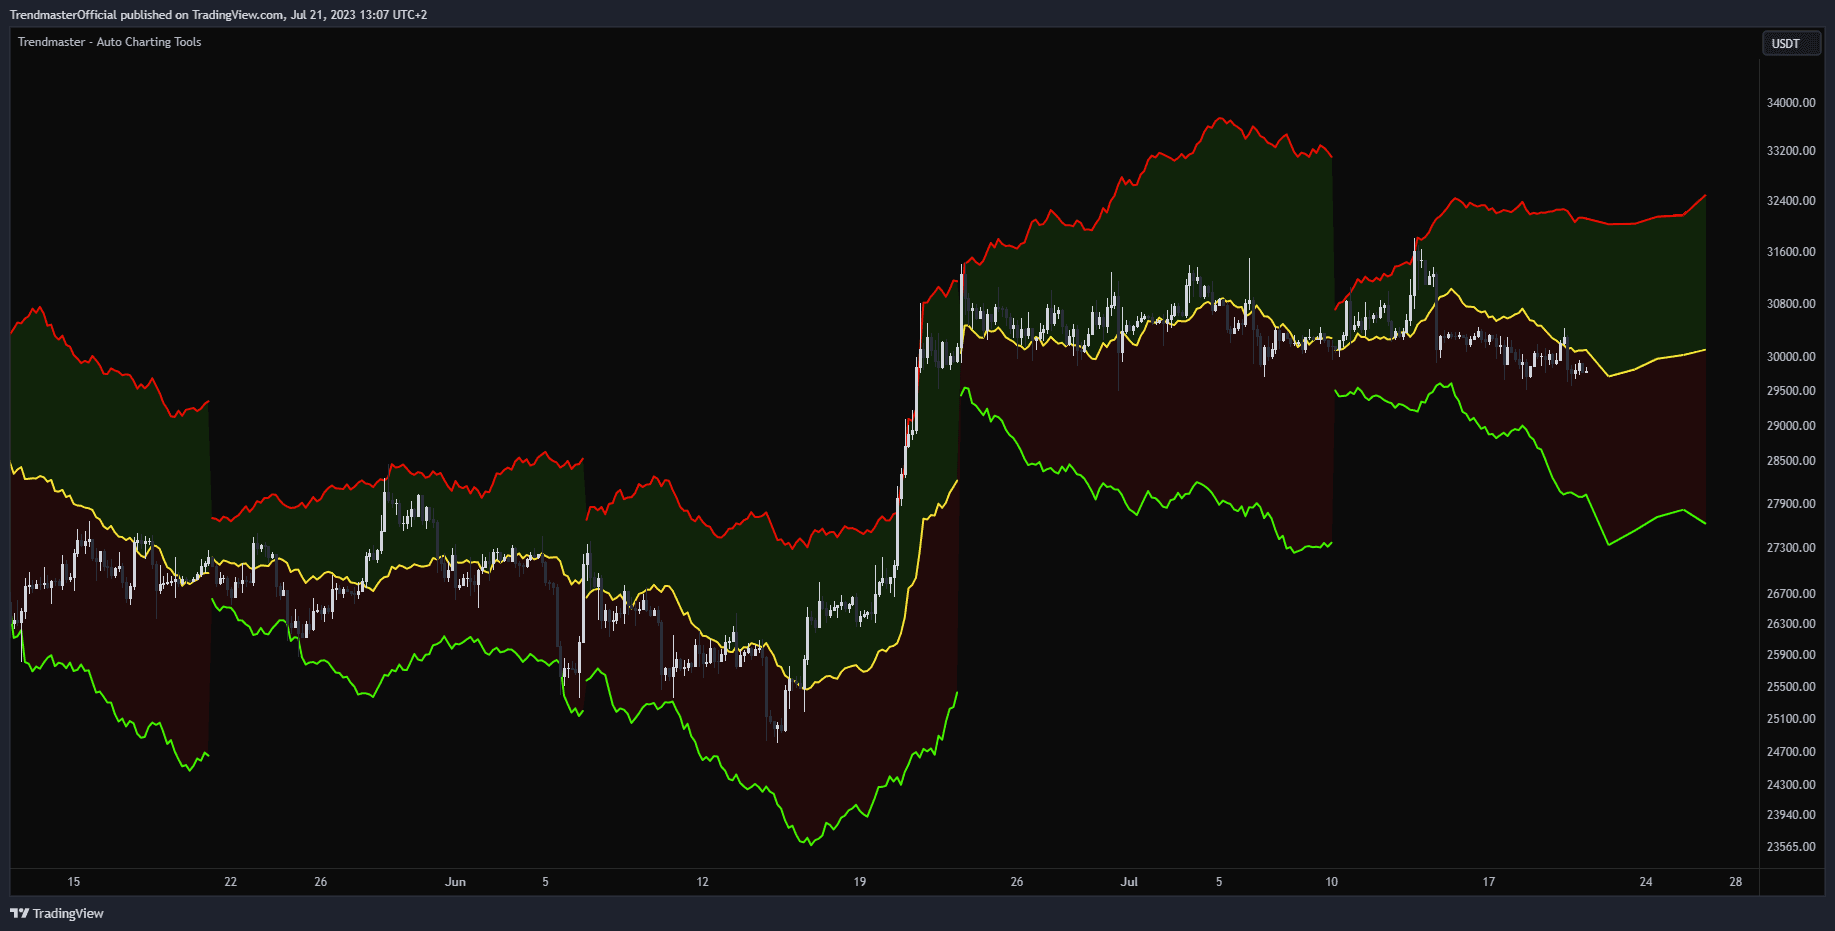
Price Projection is a tool that uses constantly evolving Price Action to predict the direction of Price. It provides insights into potential price highs and lows. By default, this tool is off but can be enabled as needed.
This tool uses three main colors to indicate the direction of Price Action; Red for above Price Action, Green for below Price Action, and Yellow for centerline Price Action.
The Red Line is above the Price Action and when the price reaches this level it indicates a higher probability of a downside reversal. The Green Line is below the Price Action and when the price reaches this level it suggests a higher probability of an upside reversal. The Yellow Line represents the Centerline of the Current Price Action. Gaining or losing this level may suggest the price will continue in that direction.
This tool is most effective on lower timeframes such as the 15-minute. Look for Confluence as price reverses off of the Green or Red levels or gains/loses the yellow centerline. It should be used in conjunction with other key tools such as S & R levels, Key Timeframes, etc.
- Name
Projection Style- Type
- style
- Description
Adjusts the type of lines used by the Price Projection Tool. The default line is solid but can be changed to dotted or dashed
- Name
Bull Color- Type
- color
- Description
The default color for the lower level of Price Projection is "ffffff" but can be changed to any color.
- Name
Bear Color- Type
- color
- Description
The default color for the higher level of Price Projection is "ffffff" but can be changed to any color.
- Name
Mid Color- Type
- color
- Description
The default color for the centerline of Price Projection is "ffffff" but can be changed to any color.
Timeframe Ranges
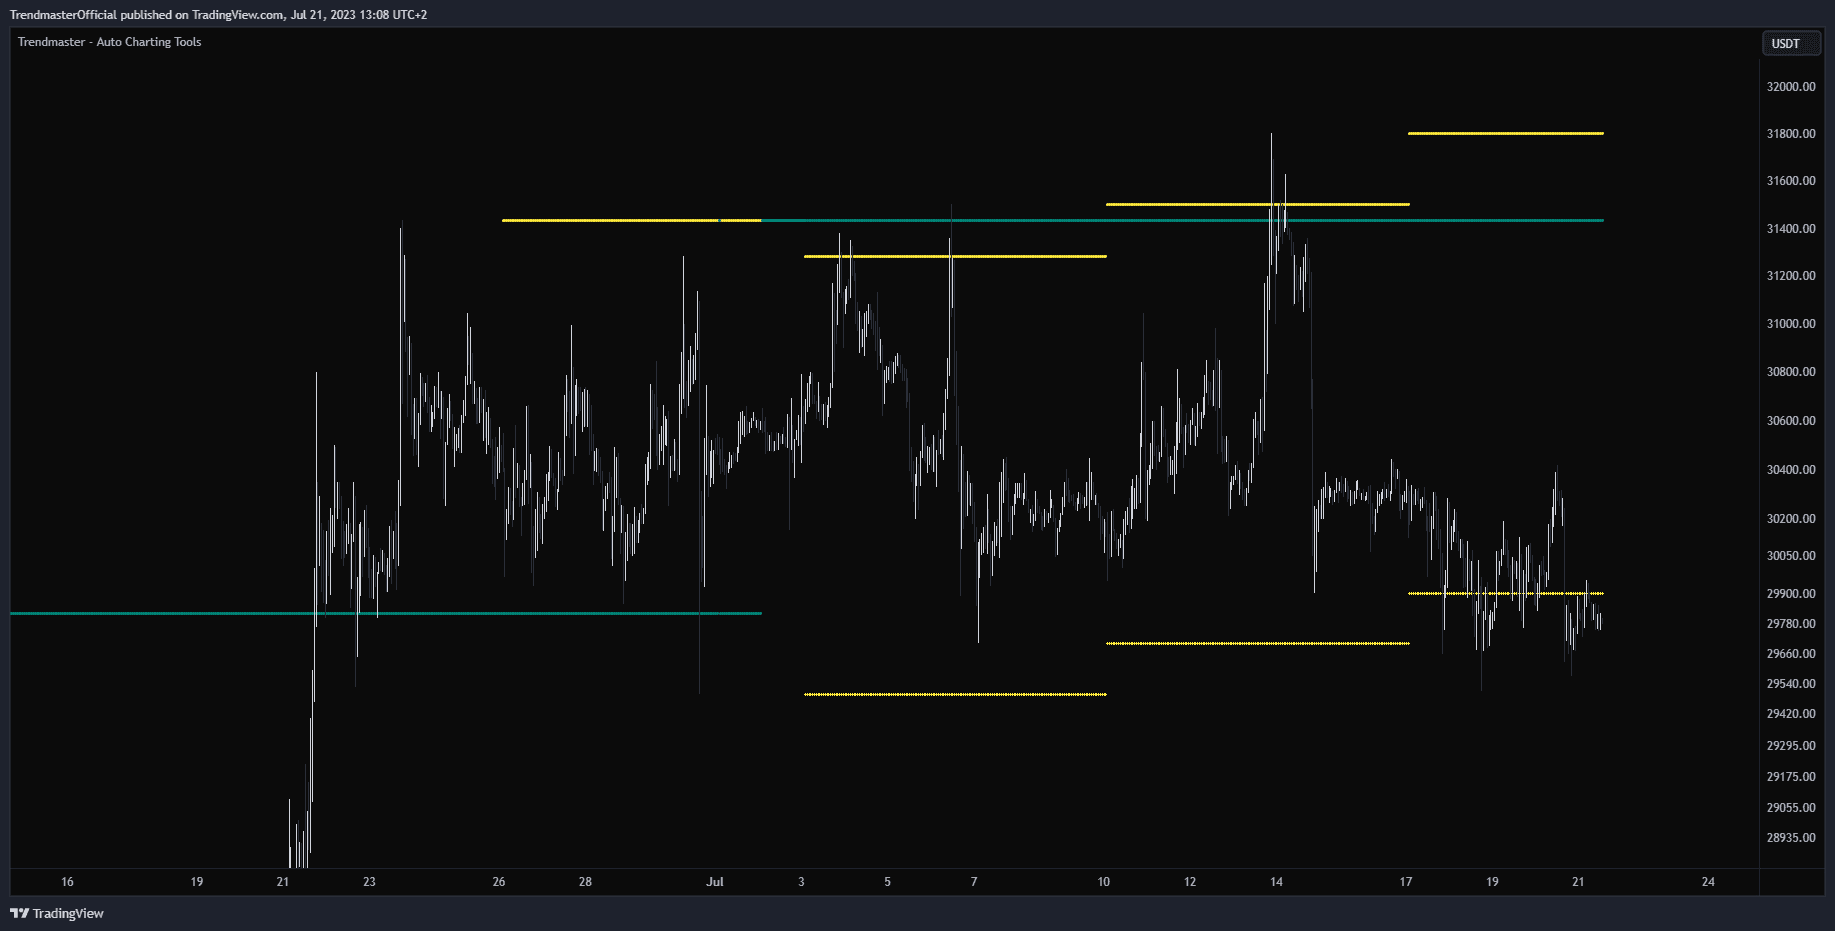
Timeframe Ranges plot the Daily, Weekly, and Monthly ranges on the current trading pair being viewed by the user. A Range refers to the difference between the low and high prices for a security over a specific period. It defines the difference between the highest and lowest prices or open and close prices traded for a specific period, such as a day, week, month, year, etc.
The Timeframe Ranges tool automatically plots the Daily, Weekly, and Monthly ranges and can be toggled between the High and Low or the Open and Close. This tool can be effectively used to determine if the Price Action is Trending or Range-bound. If the Price Action is Trending, the previous Ranges are being broken out with higher or lower current Timeframe Ranges from previous Timeframe Ranges. If Price Action is Range-bound, the indicator will show multiple Timeframe Ranges with the same or similar highs and lows or opens and closes.
- Name
Range Type- Type
- dropdown
- Description
Allows the user to choose between the range being determined at the high of the wick or low of the wick or between the open of that timeframe or the close of that timeframe. Modes: High/Low and Open/Close
- Name
Daily- Type
- checkbox
- Description
Allows the user to enable or disable all ranges on the Daily timeframe for that ticker.
- Name
Daily Color- Type
- color
- Description
The default Daily color is "ffffff" but can be changed to any color.
- Name
Weekly- Type
- checkbox
- Description
Allows the user to enable or disable all ranges on the Weekly timeframe for that ticker.
- Name
Weekly Color- Type
- color
- Description
The default Weekly color is "ffffff" but can be changed to any color.
- Name
Monthly- Type
- checkbox
- Description
Allows the user to enable or disable all ranges on the Monthly timeframe for that ticker.
- Name
Monthly Color- Type
- color
- Description
The default Monthly color is "ffffff" but can be changed to any color.
Global Sessions
Global Sessions is a tool that shows the levels of Price Action as they relate to Global Market Sessions. The 3 main sessions are in separate timezones and here they are listed concerning GMT or Greenwich Mean Time. the Asian Session is from 11 p.m. (23.00) to 8 a.m. (08.00) GMT, The London Session is from 7 a.m. (07.00) to 4 p.m. (16.00) GMT, and the North American Session is from 12 p.m. (12.00) to 8 p.m. (20.00) GMT.
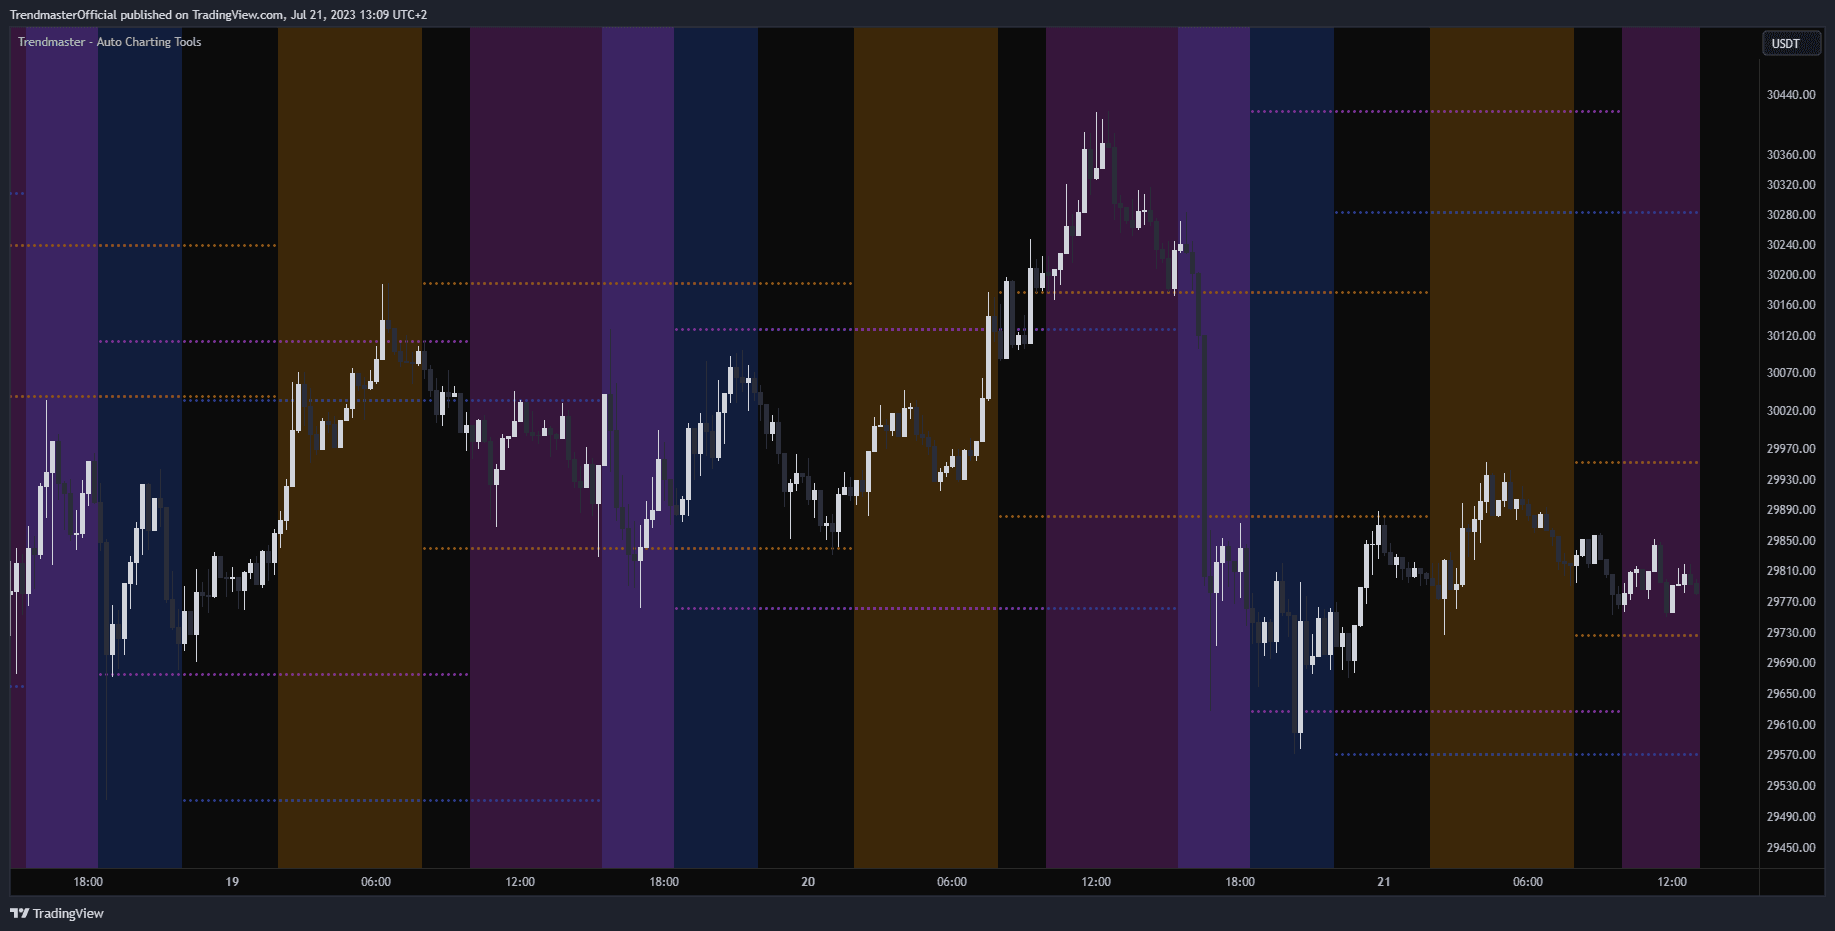
The 24-hour forex and crypto trading session can be broken down into three manageable trading periods. Traders often focus on one of the three trading periods, rather than attempt to trade the markets 24 hours per day. Peak activity periods are the Asian, European, and North American sessions, which are also called Tokyo, London, and New York. Sometimes sessions will overlap, such as the four hours of peak activity in both Europe and North America. Volatility is sometimes elevated when Forex and Crypto trading sessions overlap
Example of Use
The Trendmaster - Auto Charting Tools is a highly customizable Indicator that shows key levels as they relate to the Current Price Action. Some of the most important tools to use are the Timeframe Opens and the S & R Levels as they show the higher timeframe important levels on the current Trading Pair.
- Using those 2 Tools as a base and then testing other aspects of the indicator the goal should be to create a “Confluence” of those key levels. An example of this would be if a Weekly S & R Level coincides with several Timeframe Opens that also happen to be a Swing Point and a Daily Range High creates “Confluence” for the relevance of that level. The more “Confluence” a level has increases the probability that the level will be important concerning reversals, gains, and failures.
- On lower timeframes tools such as Price Projection and Trendlines can show moving levels of Support and Resistance and show potential points of reversal.
- Combining multiple points of “Confluence” to highlight key levels for potential reversals or breakouts and do it instantly and automatically saves time for the trader as they scan through the different Trading Pairs that they are interested in trading.